An often forgotten formula for the mean of a random variable 
=\sum_{x=0}^{\infty} \Big(1-F(x)\Big)")
And for the continous case:
=\int_{x=0}^{\infty} \Big(1-F(x)\Big)")
This blog post is going to illustrate how these formulas arise.
more →An often forgotten formula for the mean of a random variable
And for the continous case:
This blog post is going to illustrate how these formulas arise.
more →Those of you who already have tested for the variance of data from a normal distribution may have asked themselves how the link between normal variance and chi-squared distribution arises. Trust me: The story, which I will tell you, is an exciting one! more →
It was really surprising for me when I thought about this kind of operation, namely division by arithmetic means and expected values. People tend to work with means and expected values very intuitively. You can add and multiply them without any issues. Dividing on the other hand can be misleading and I am going to illustrate this with some neat examples.
Imagine that a friend of yours would like to play a game. Your friend writes down two different numbers on two separate slips which you cannot spot. Afterwards you are allowed to choose one of the slips and read the number written on it. The game’s goal is to make a rough guess on the value of the second number.

You think there is a 50:50 chance for guessing correctly? Although you may not believe it: The probability for a success is definitely higher when you apply the following strategy! more →
I guess that you already know a little bit about hypothesis testing. For instance, you might have carried out tests in which you tried to reject the hypothesis that your sample comes from a population with a hypthesized mean µ. As you know that the sample mean follows a t-distribution (or the normal distribution in case of huge samples), you can define a rejection region based on a specific significance level α. In a one-sided test, sample means which are less than a critical value CV might be considered to be rather unlikely. If the obtained sample’s mean falls into this region, the hypothesis gets rejected at this particular signficance level α.
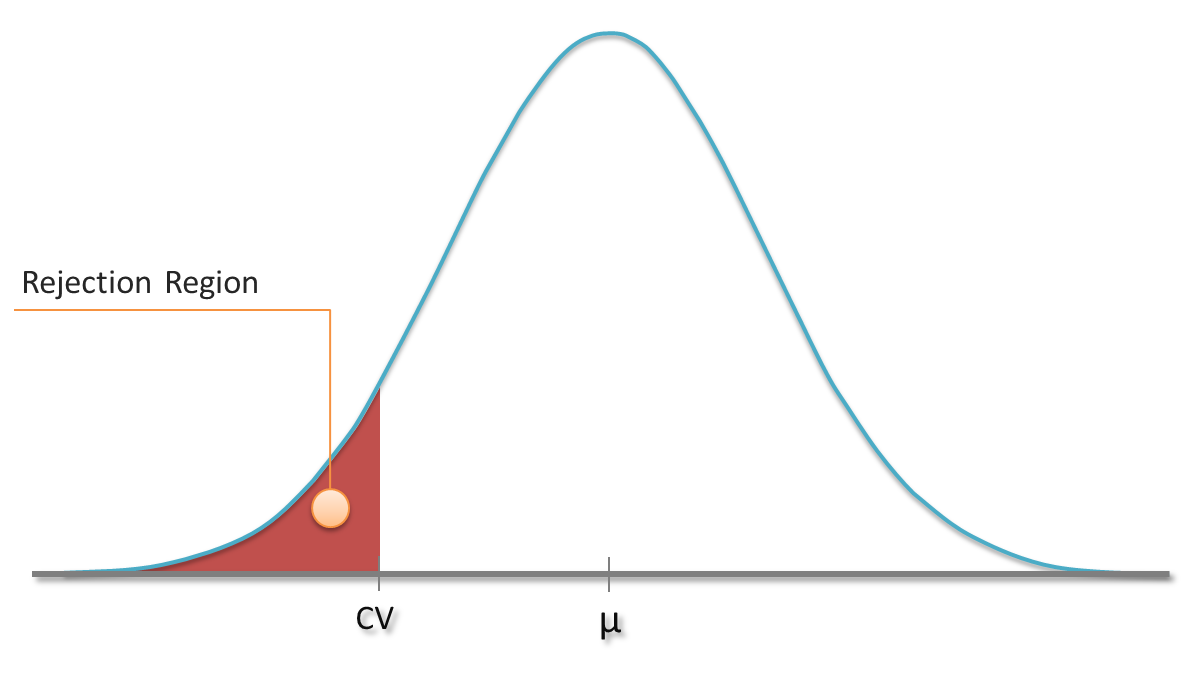
Distribution of sample mean and rejection region for one-sided test
We know the chance of rejecting the hypothesis although it’s true (Type I error), because it is the chance of obtaining just one of those values from the rejection region (plotted red). But how likely are we to reject a hypothesis if it’s indeed false? In other words: How small is the type II error? more →
Having a model to predict the performance of a share would be great, wouldn’t it? In this article I will show that such a model indeed exists. From a statistician’s point of view, the rate of stock return follows a particular probability distribution (which is also one of the preconditions of the Black-Scholes model). Assuming that parameters remain stable over a period of time, we can also give probabilities for some rates of stock return. Got curious? more →
Quick question: Is BASF’s day-to-day rate of stock returns (shown below) distributed normally?
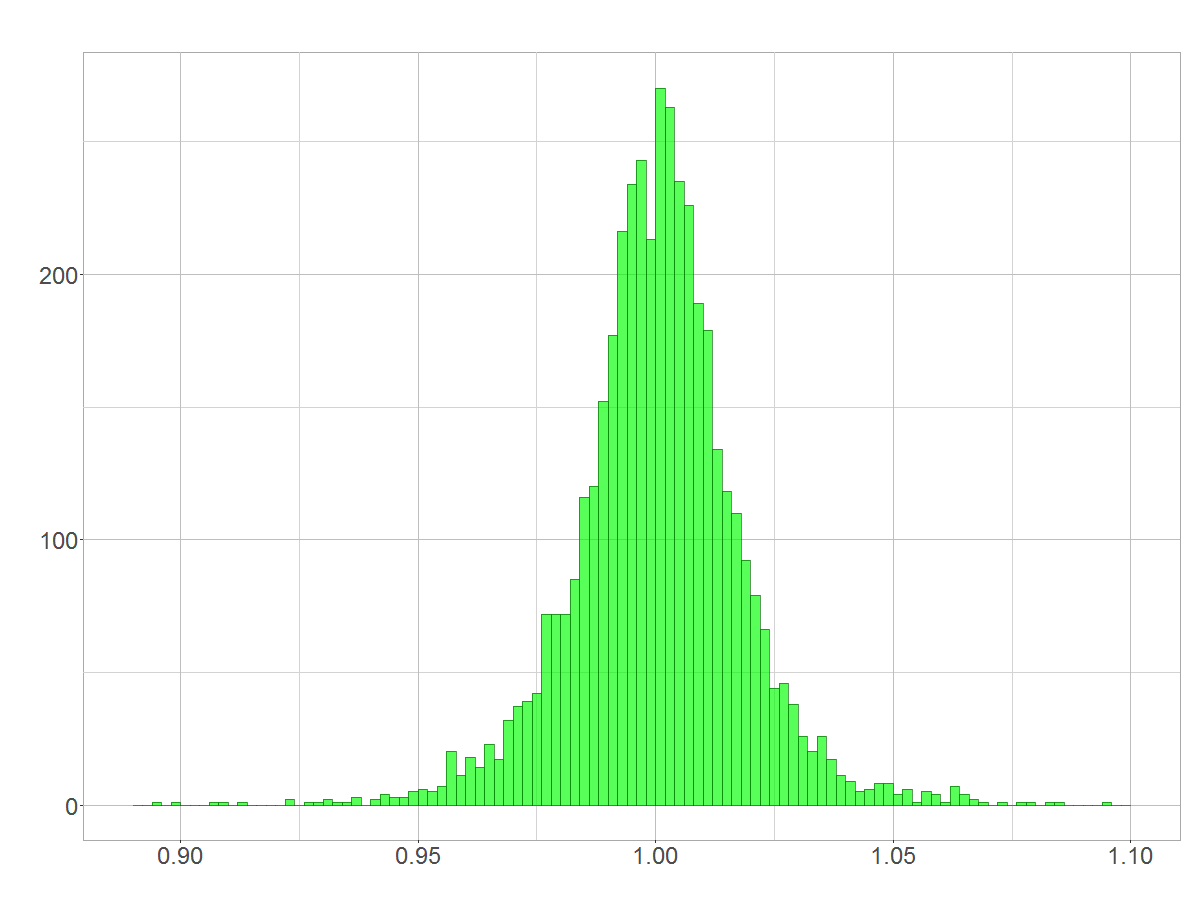
Day-to-day rates of return of BASF stock
Yes? In theory it isn’t! In theory rates of stock returns follow a lognormal distribution as I have shown in “On the distribution of stock return”. Unfortunately, most people don’t take the lognormal distribution serious, although it is very often at work! This article shows how the lognormal distribution arises and why its shape sometimes mistaken for a normal distribution. more →
One of statistic’s foundations lies in the fact you can add variances. Maybe you wonder a little bit, because the formula for the variance does not look like that at first glance. This article will show you the proof why and under which circumstances adding variances is a valid practice. Please check the information given in my articles on addition and multiplication of expected values, if you do not have collected experiences with it yet. more →


© 2026 Insight Things
Theme by Anders Noren — Up ↑