Quick question: Is BASF’s day-to-day rate of stock returns (shown below) distributed normally?
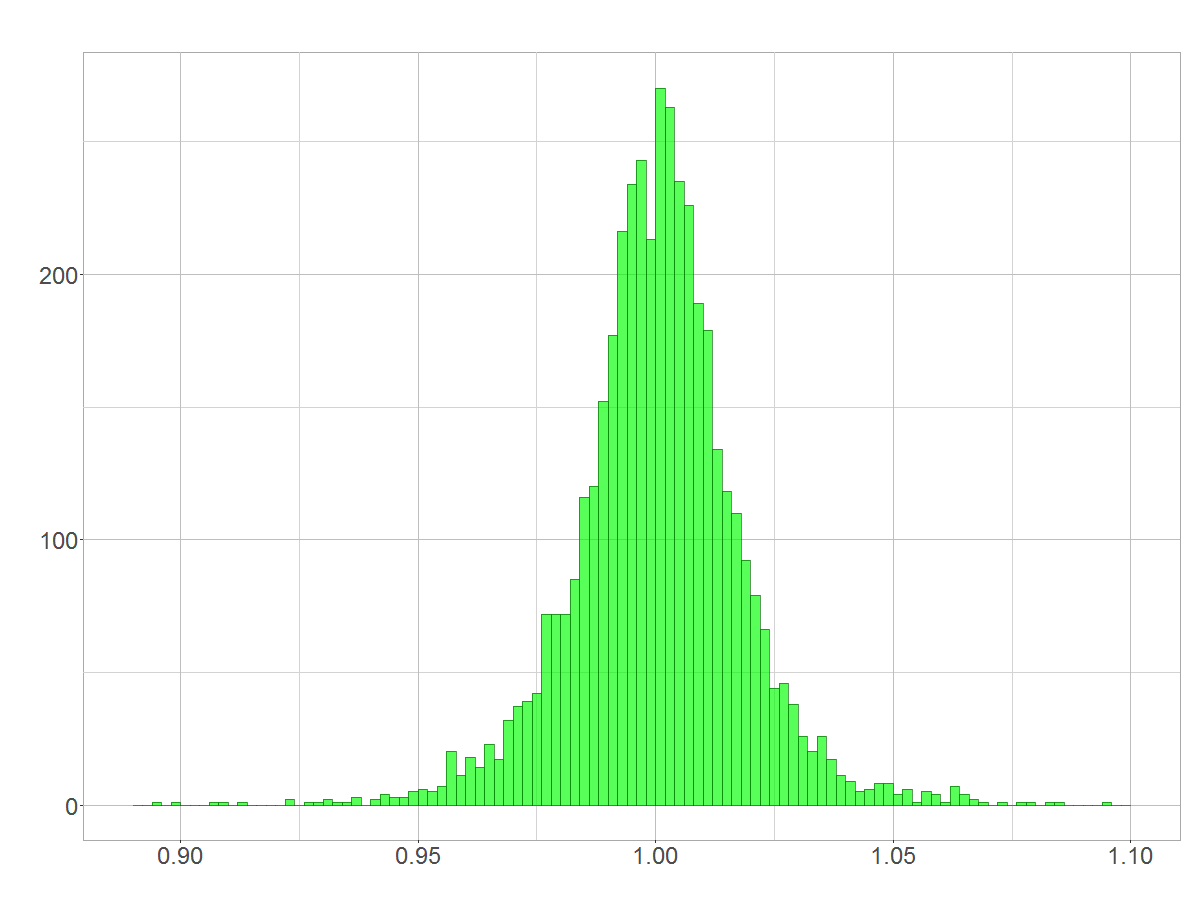
Day-to-day rates of return of BASF stock
Yes? In theory it isn’t! In theory rates of stock returns follow a lognormal distribution as I have shown in “On the distribution of stock return”. Unfortunately, most people don’t take the lognormal distribution serious, although it is very often at work! This article shows how the lognormal distribution arises and why its shape sometimes mistaken for a normal distribution.
Relationship between normal and log-normal distribution
A log-normal distribution arises when several random variables are multiplied. Let 


In case 
}=e^{\ln N_{1}+\ln N_{2}+ \ln N_{3}+\dots}=e^{X}")

As you’ve seen, exponentiating a normal distribution leads to the log-normal distribution. The conclusion is also that each log-normal distribution has its underlying normal distribution! For those of you who like graphics, I illustrated the transformation below.
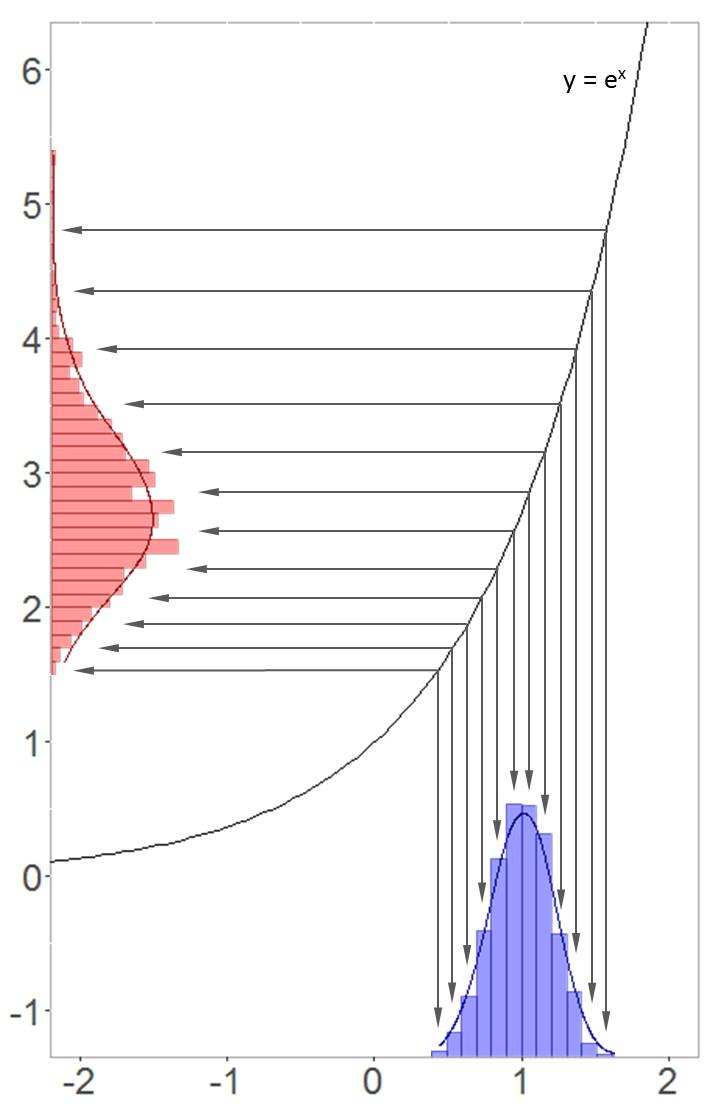
Transformation between normal and log-normal distribution
Higher values of the underyling normal distribution get more spread out when exponentiated. Hence, the log-normal distribution is positively skewed (as show in the picture above).
Risk of confusion
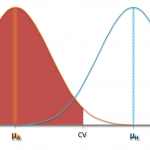
Now, how could it be that both distributions can be confused with each other? To show that, I produced a normal distribution with mean zero and an relatively small standard deviation. See the transformation in this case:
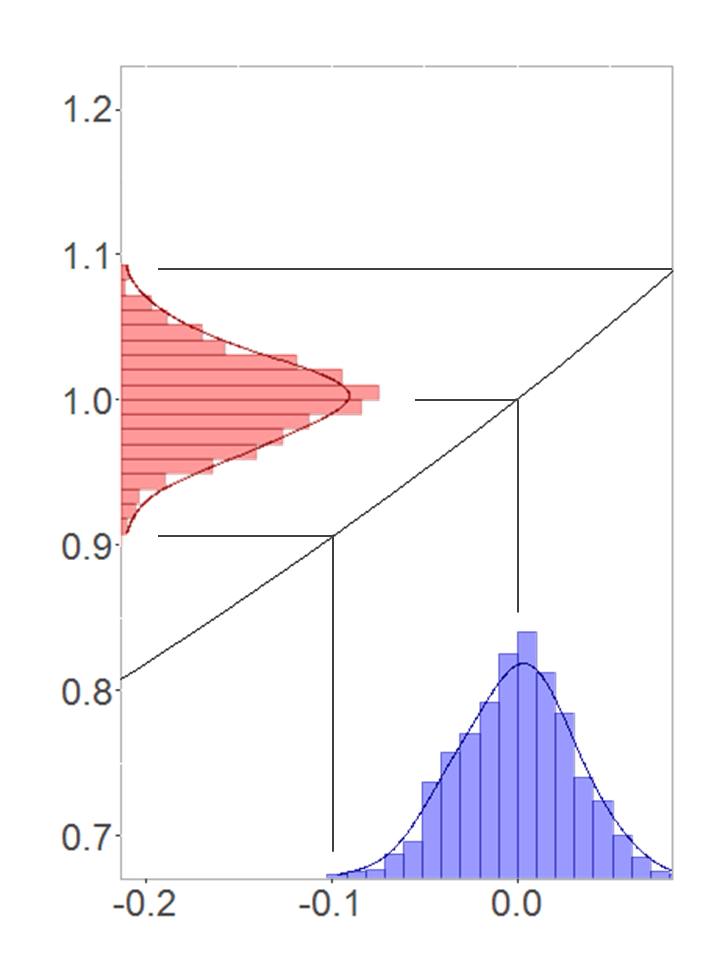
Symmetric transformation between normal and log-normal distribution
Small sections of a function graph can reasonably be approximated by a straight line. In this special case the derivative of the e-function at 
You should bear this effect in mind when working with small values. But you are not much safer with high values either. As the mean of the underlying normal distribution increases, its standard deviation just has do decline to still achieve this effect.


April 6, 2016 at 6:18 pm
Asking whether data are normal or lognormal is usually not useful. In the real world, data are never really normal, lognormal, or anything else. The real world always deviates from simple models.
A more useful question is which of these analytic distributions is a good (or good enough) model of the data. There might be more than one.
The example in this post is data generated by a lognormal distribution with relatively low variance. Based on the histogram of the data, it looks like a normal model might be a reasonable choice. It might be off in the right tail, but for an application where tail behavior is not important, that might be ok.
May 25, 2016 at 5:44 am
You’re right. It might be ok to work with a normal probability distribution. However, I fear that people could deduce that, for instance, stock returns are normally distributed in general (which is not true). This post wants to say: Be careful with conclusions regarding distribution 😉