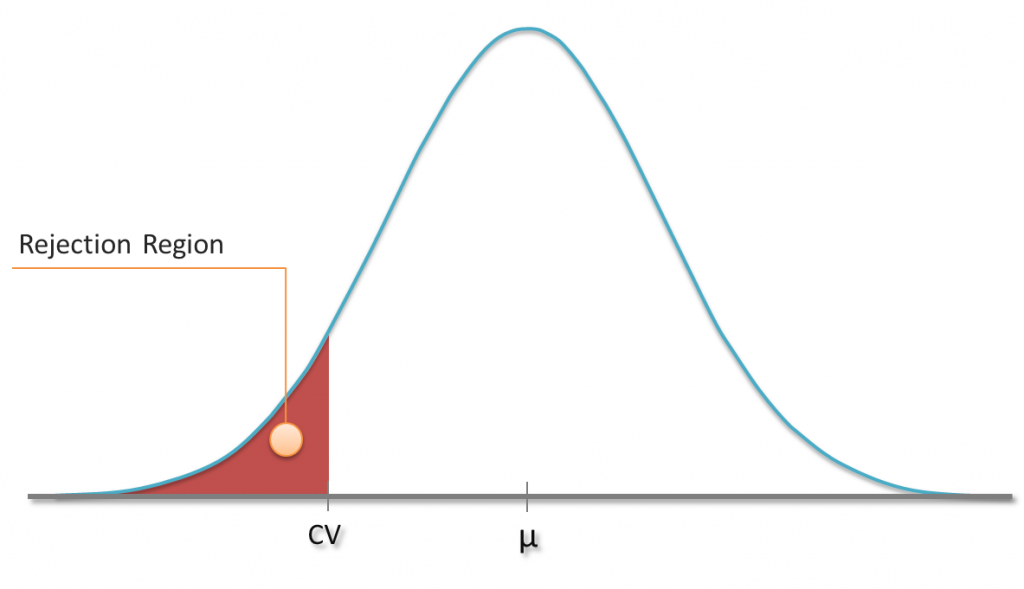
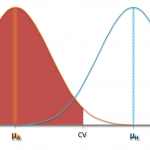
I guess that you already know a little bit about hypothesis testing. For instance, you might have carried out tests in which you tried to reject the hypothesis that your sample comes from a population with a hypthesized mean µ. As you know that the sample mean follows a t-distribution (or the normal distribution in case of huge samples), you can define a rejection region based on a specific significance level α. In a one-sided test, sample means which are less than a critical value CV might be considered to be rather unlikely. If the obtained sample’s mean falls into this region, the hypothesis gets rejected at this particular signficance level α.
We know the chance of rejecting the hypothesis although it’s true (Type I error), because it is the chance of obtaining just one of those values from the rejection region (plotted red). But how likely are we to reject a hypothesis if it’s indeed false? In other words: How small is the type II error?
Statistical Power of Test
Let’s take up the example from the introduction again. We call the hypothesized mean µH and still expect the same null distribution of the sample mean in case the hypothesis was true. Also the critical value remains constant.
Now imagine we knew the actual mean µA. In this example we would simply expect the same distribution for the sample mean centered around µA. The probability of obtaining a particular range of sample means can be calculated using this t-distribution. Since we reject the hypothesis for sample means which are less than CV, we can now give the probability of rejecting the hypothesis that µ=µH if it’s actually µA!
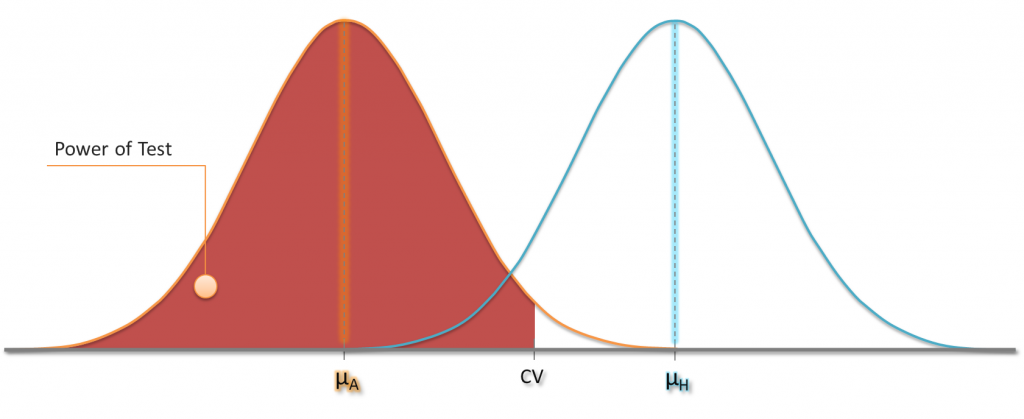
Power of a test: The probability of rejecting a hypothesized population mean when it’s actually not the true mean.
You can choose different values for µA and that way get a feeling how the statistical power changes with sample size, for instance. A power of 80% means a type II error of 20% and so on. The real challenge is to find a good tradeoff between type I and type II error, but this is something I won’t cover in this post.
Million Options
I didn’t give any formulas, but don’t worry 😛 If you understood my explanation above, you will be able to compute most kinds of power.
As an example, you can extend the idea to obtain the power of two-sided tests. And there it just starts! Employ the principles to calculate the power of tests involving Poisson or Binomial distributions. What happens if you choose the wrong null distribution? So, does running a z-test on a small sample would have great impact on the test’s power? Calculate several scenarios for likely sample variances and and and….
There are no limits!



April 26, 2016 at 4:24 am
Hello.This article was really interesting, particularly since I was searching for thoughts on this issue last Sunday.
May 27, 2016 at 6:26 pm
Excellent resource! I had to prepare some work for school as we are discussing hypothesis tests. You actually took some confusion from the topic “power of tests”. I also found the following page very helpful: http://rpsychologist.com/d3/NHST/
May 27, 2016 at 6:40 pm
I’m glad you found what you were looking for. The page which you linked to looks amazing!