I like white sneakers and I don’t want them to become dirty. That’s why I always check on the next day’s precipitation probability. If I intend to leave only for a couple hours, then the breakdown of the rain risk is of particular interest to me. When comparing the probabilities on hourly and daily basis I could rarely figure out the relationship between both. Consider the following weather forecast:
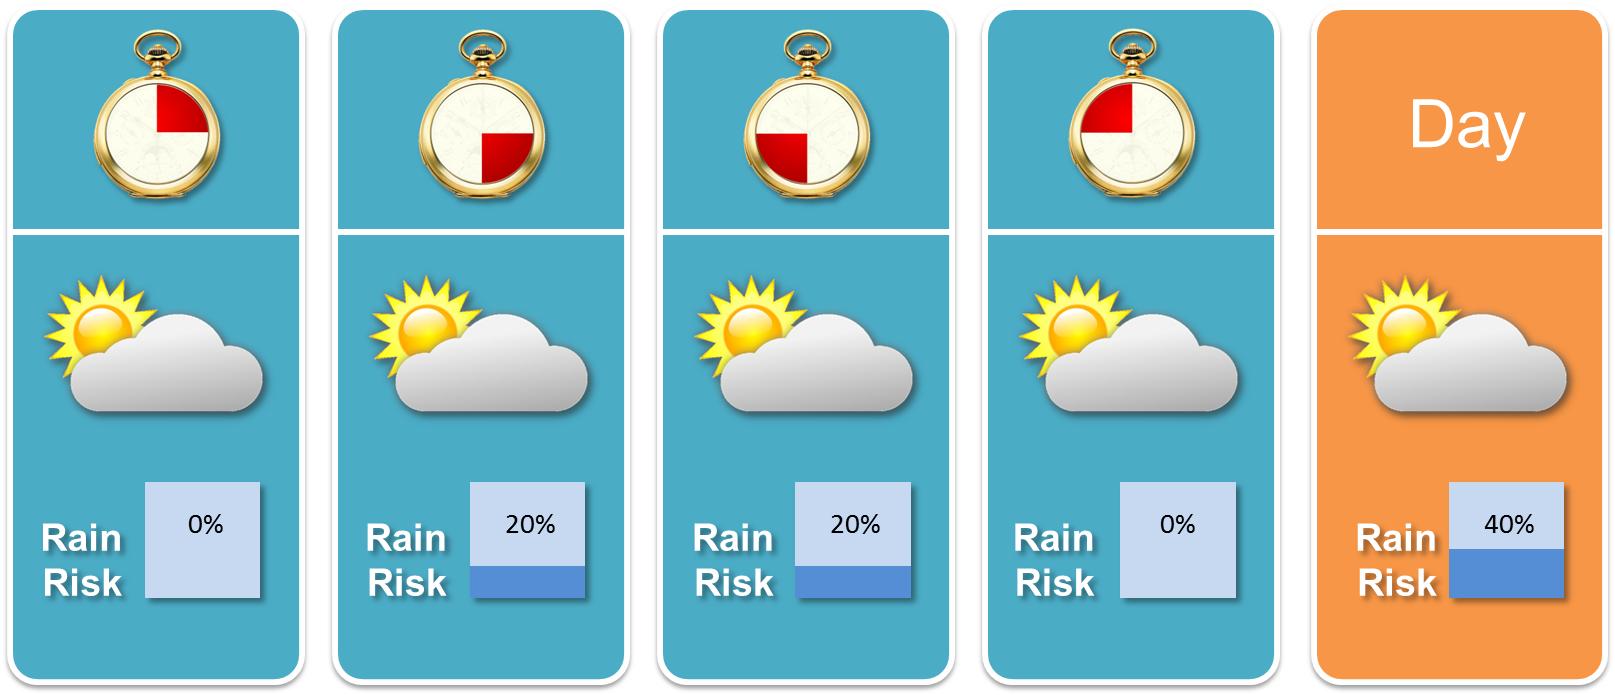
Fictional weather forecast on daily and 6-hours basis
For simplicity I chose to present the rain risk for periods of 6 hours length. Anyway, in what way are the daily rain risk of 40% and its breakdown of 20% over 12 hours related? Can we trust the weather forecast’s statements anyway? This article will discuss the topic.
Definition of precipitation probability
Well, some people may struggle with the terms rain risk, rain probability or precipitation probability at all. 20% rain risk doesn’t mean that it will 20% of the time. And it doesn’t mean that it will rain in 20% of the forecasted region.
In Europe it is usually defined as the probability that it will rain in a given region within a given time frame at all while the U.S. includes the area coverage (this is referred to as Probability of Precipitation (POP)). Anyways, relevant for this article is to note that the time frame might be an hour, 6 hours, a day, a whole month and so on. The most common ways to gain such data are to run a chaotic weather model for a couple of times with slightly different parameters or simply by taking a look at past rainy days with comparable weather conditions (such as humidity, temperature, cloud formation, …). From the emerging samples on later hours, days, months and so forth, probabilities can be calculated.
Breakdown of precipitation probability
Now let’s get to the more advanced aspects of precipitation probability and have a look at the example from the beginning. Obviously the probability on a day basis doesn’t equal the maximum probability on hourly basis. Also adding the probabilities doesn’t seem to do the trick as you can easily obtain more than 100%. Those of you who enjoyed some stats in school may come up with the idea of multiplying the complementary probabilities (that it doesn’t rain). Unfortunately, there is still a gap between the result and rain risk on a daily basis:
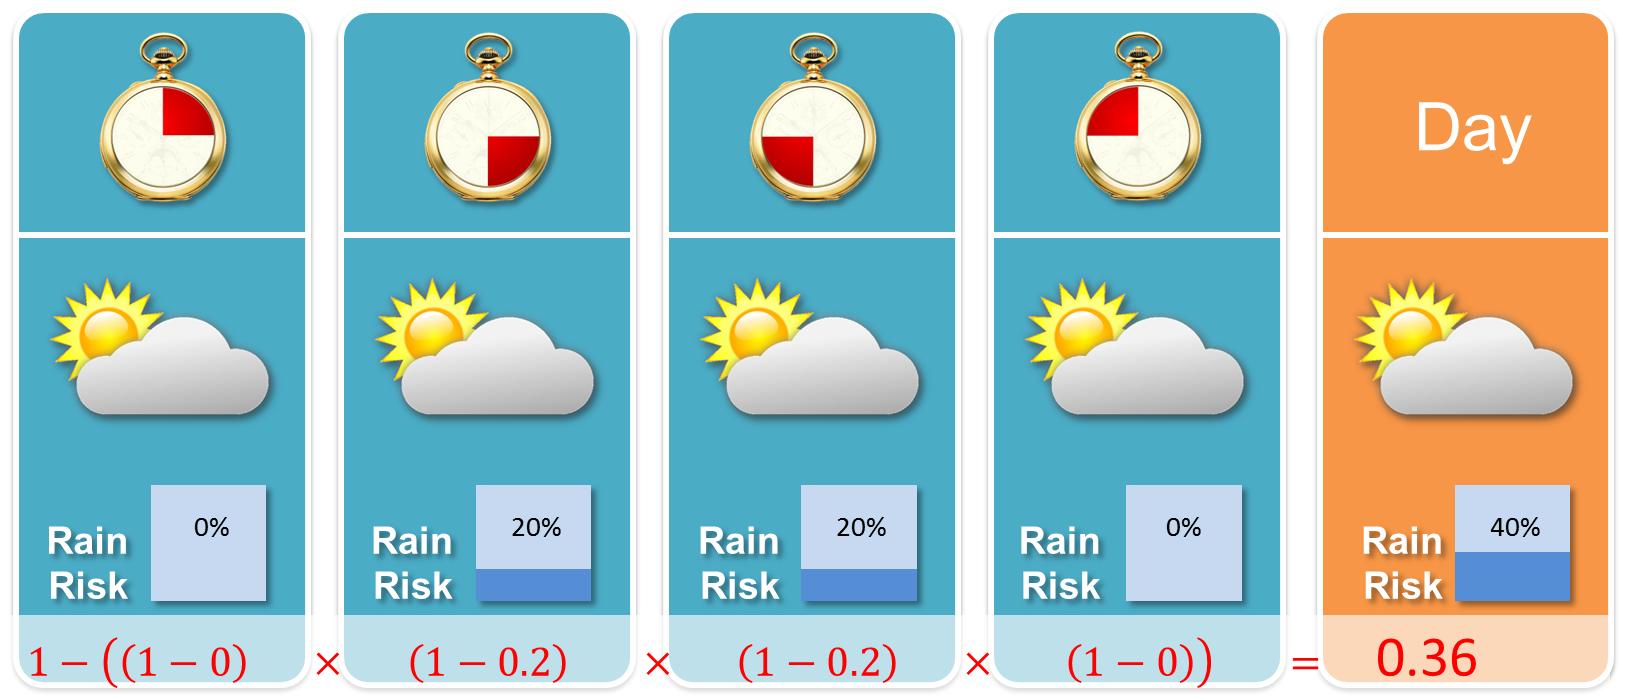
The multiplication of complementary events still gives a gap
As a next step you might want to blame me for making a mistake when I made up the example. Let me convince you. Using data on former weather events or simulating suitable scenarios, the given example might arise from the following sample:
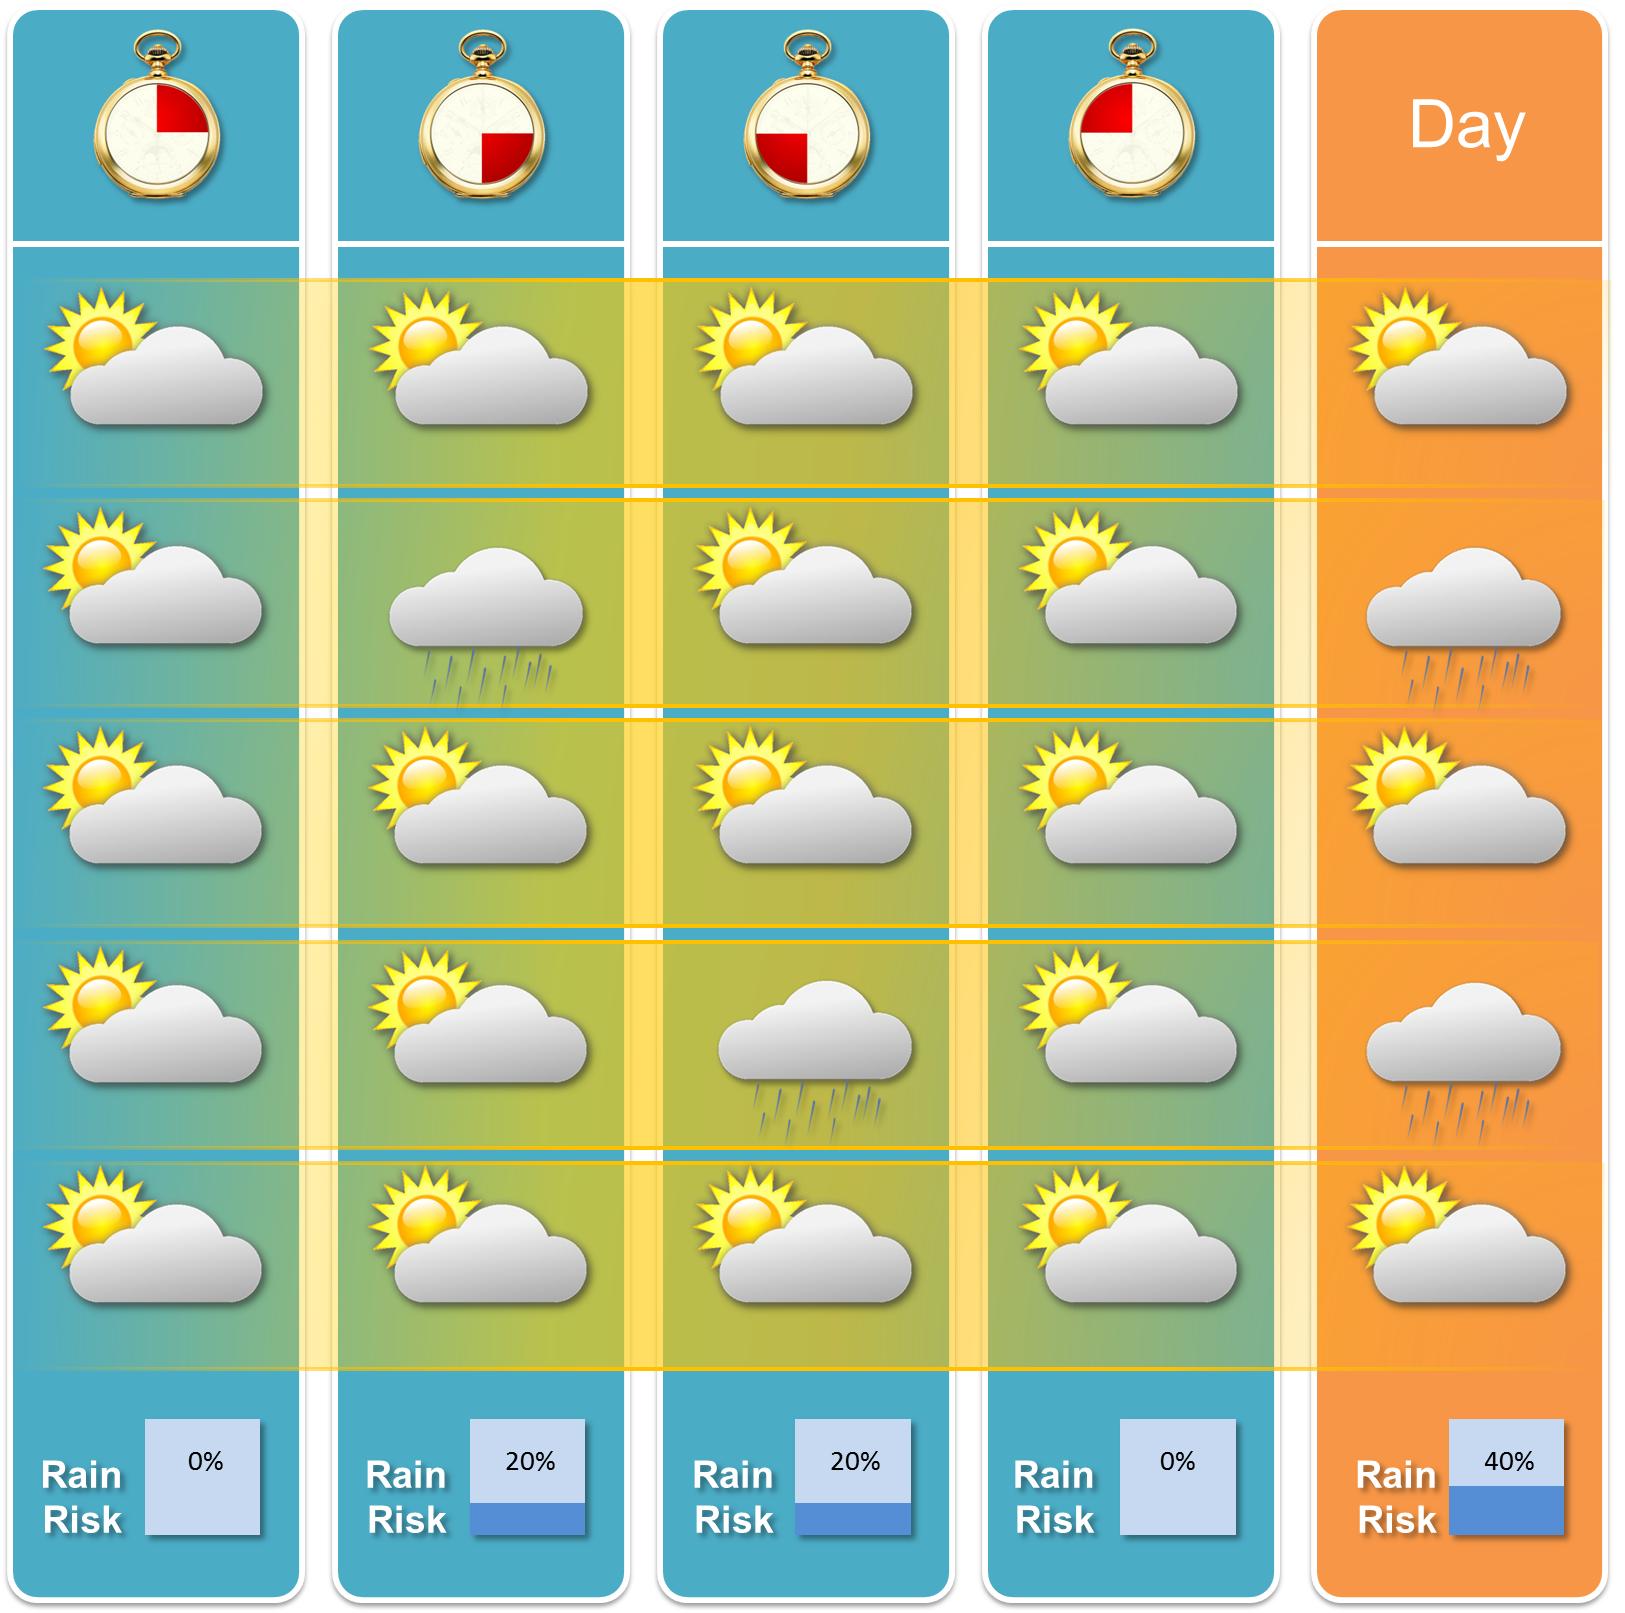
Sampling of precipitation data to obtain the example
So there is a definite chance that my example is valid 😉 But why does the gap between rain risks based on different time intervals arises then?
Some explanation
First, the precipitation probabilities are just estimates obtained by sampling. And obviously our sample above doesn’t contain any case in which rain occurs for both time frames in the middle, although we would expect it occasionally. Naturally, we cannot expect our calculations to match an unrepresentative sample.
Larger samples may lead to better results. Nontheless, I claim that we still would observe differences. The reason is that we need to assume independence of events when multiplying the complementary events’ probabilties. Think about it and you will find this assumption rather unlogical. Consider some dark clouds moving fast above your heads giving only some seconds of heavy rain. Then it seems more plausible that it will rain only in one of both time intervals rather than in both. I exaggerated a little bit below. Notice that for this sample the rain risk equals 100% on a daily basis but only 75% when treating rain whilst the single time frames as independent events.
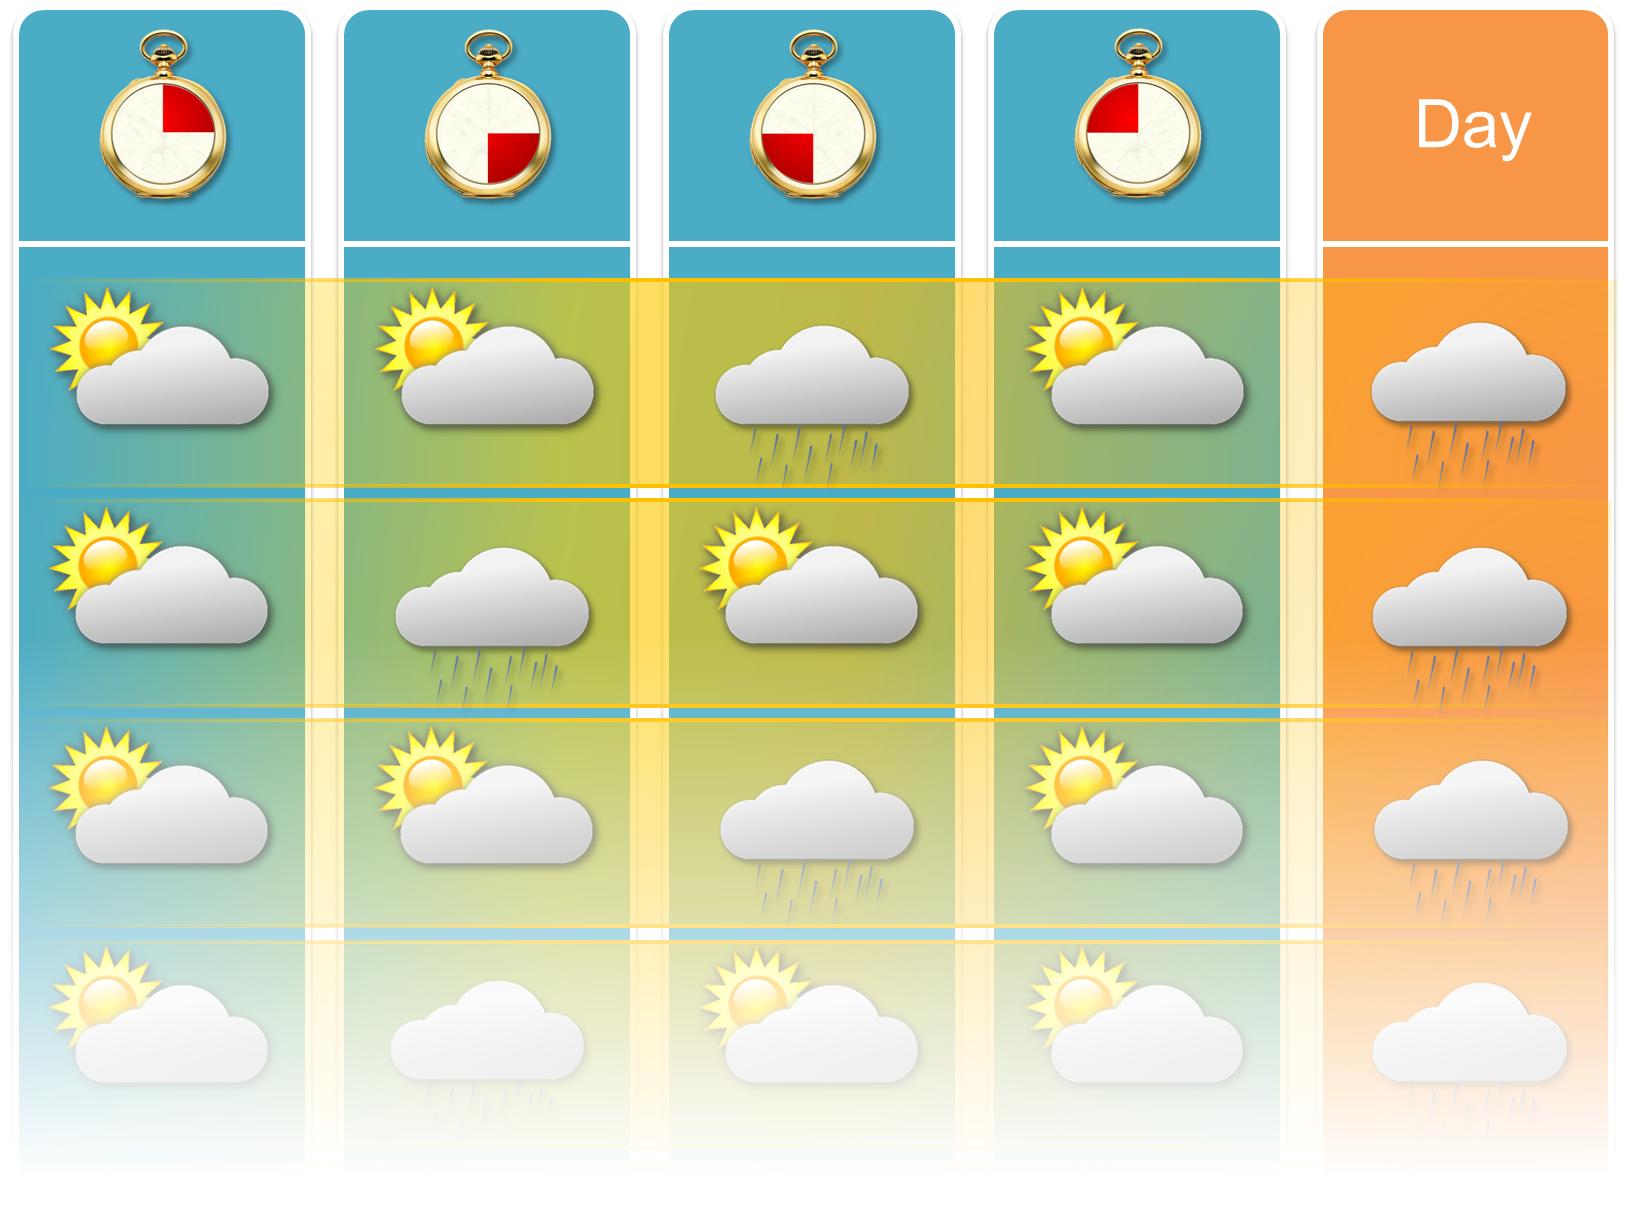
Sample of dependent precipitation data
Last but not least, the meteorologists could still have committed an error when setting up their models. Since I am not very familiar with their modelling process, I will not discuss this point any further.
Conclusion
What can we conclude from all that? Well, don’t try to interpret too much into the difference between the forecast on daily basis and its breakdown to smaller time frames. Further we can state that the more detailed forecast can be misleading at times. The example in the previous section pointed it out: If it has rained already before noon, I could leave the house in the afternoon without fearing rain – although the rain risk stated by the weather forecast is 20%…

 (17 votes, average: 4.82 out of 5)


Leave a Reply